How to Build Custom Reports Using Data Explores
Data Explores
Building Reports
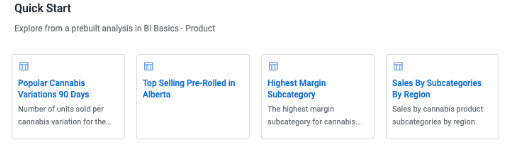
Quick Start
To begin building your report, using the left hand side navigation you can collapse fields by category to access more granular dimensions and add in each column into your report. Dimensions can be implemented as columns or used only as filters on a report.
Custom Reports
Custom reports can be built without using a quick start selection, using the fields dimensions and measures options on the left-hand side of the explore page.
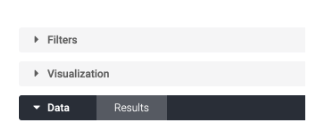
Fields
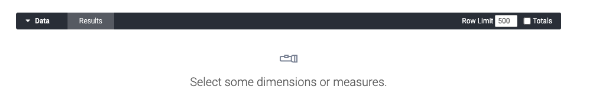
Columns: To add a column, simply click on the field (it should be grayed and also show on the right hand side under the ‘Data’ section.
Descending/Ascending orders
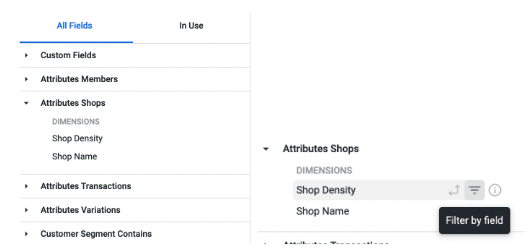
Filters: To add a filter, select the funnel symbol (hover over reads filter by field) and this will appear under the ‘Filters’ section of the top right hand side of the page.
To pivot the entire data by one field of data, the pivot data selection via the arrows can be selected. This can also be done from the column name.
The filters section can be collapsed to show all filter field selections made from the left-hand side fields options. Each individual filter criteria must be set before running for it to be applied. Some filters have multiple selection options.
Filtering explore by selecting a name in a column
All Fields vs In Use Tabs

All fields - This is a selection of all the available fields within the particular explore. They are categorized by hierarchy.
In Use - The in use tab highlights only those selected currently to build the right-hand side report.